
PQL Scoring Engine
PQL Scores help product-led companies monetize their customer base by identifying which accounts or users have the highest likelihood to convert, expand, renew, or even churn. This is very similar to MQLs, but rather than using engagement metrics, it uses product usage metrics on top of customer data to build a score.
If you’re looking to implement scores without devoting months of engineering time and countless dollars in resources, you’re in luck! With Correlated’s AI-powered propensity scoring models, you can set up PQLs and PQAs across your customer lifecycle with just a few button clicks.
Correlated handles all the hard work of wrangling your data, training a model, and predicting results so that you can get to a prioritized, product-qualified lead funnel out of the box.
How It Works
1. Import customer data into Correlated.
- Navigate to the Integrations page to start importing data, and refer to our Connection Docs for assistance.
- At a bare minimum, you'll need to send the following data:
- All your accounts in a table (or other supported data source)
- All your users in a table (or other supported data source)
- Product events (either as raw events or rolled-up metrics)
- Data that represents the "goal" you'd like to achieve
- More firmographic data points about your accounts/users is also recommended like ARR, subscription / billing data, company size, job titles, etc.
2. Map your data in Data Mapping.
- Once data has imported, go to the "Settings" tab and click into "Data Mapping."
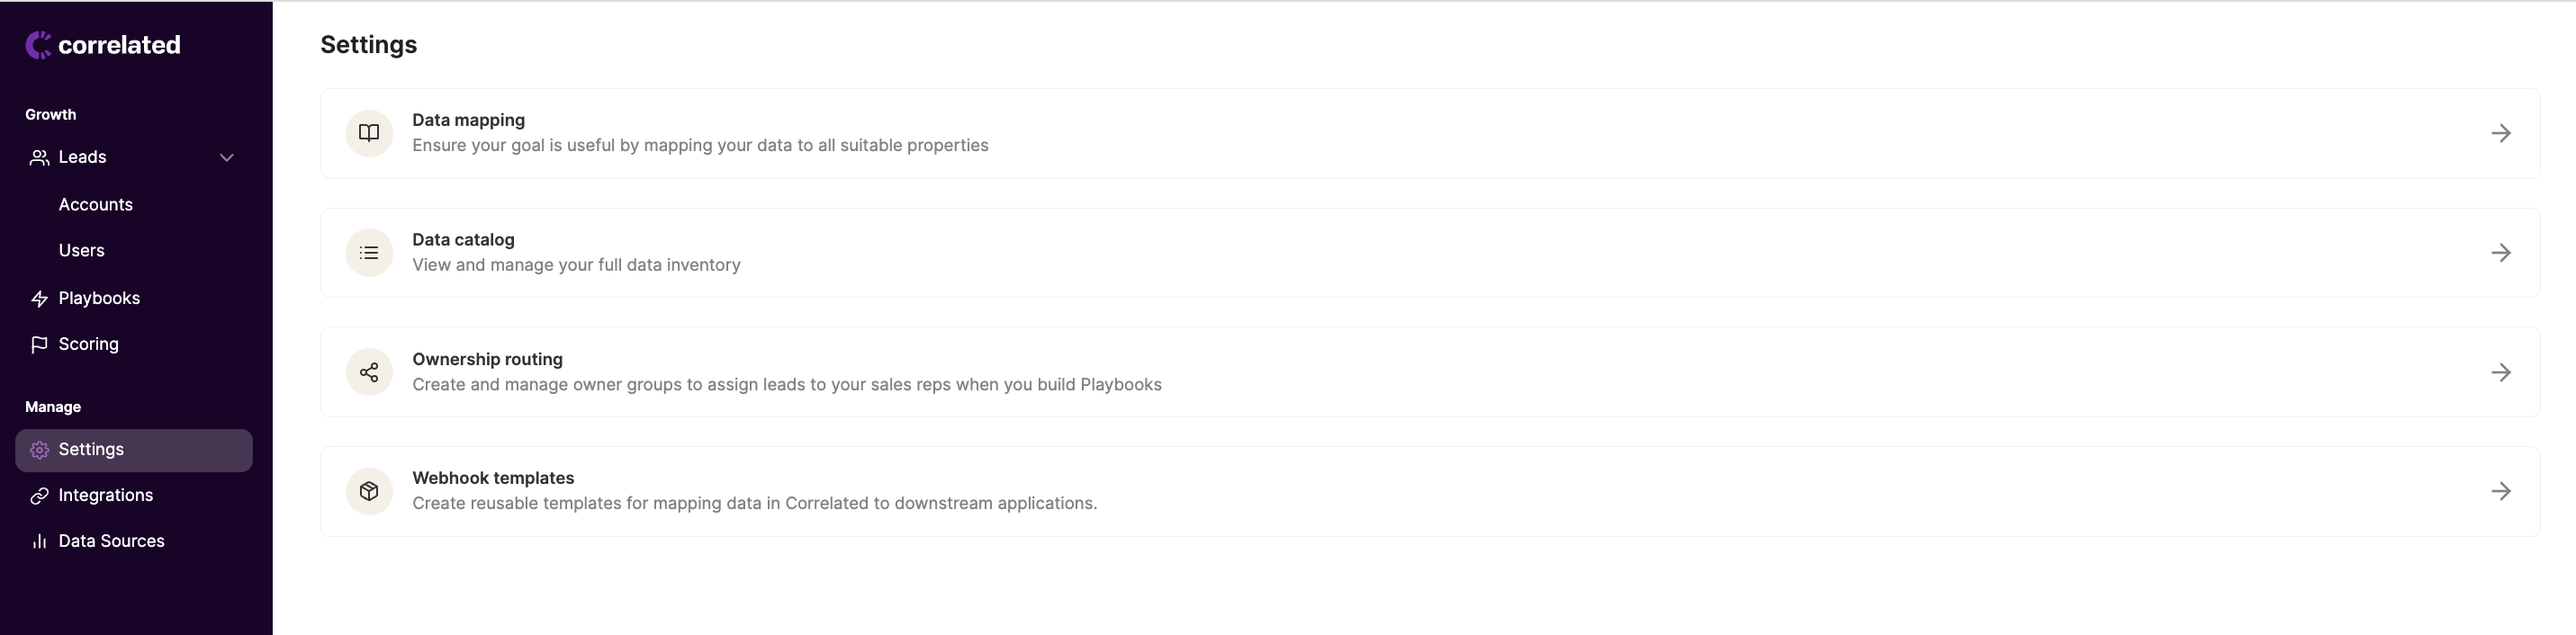
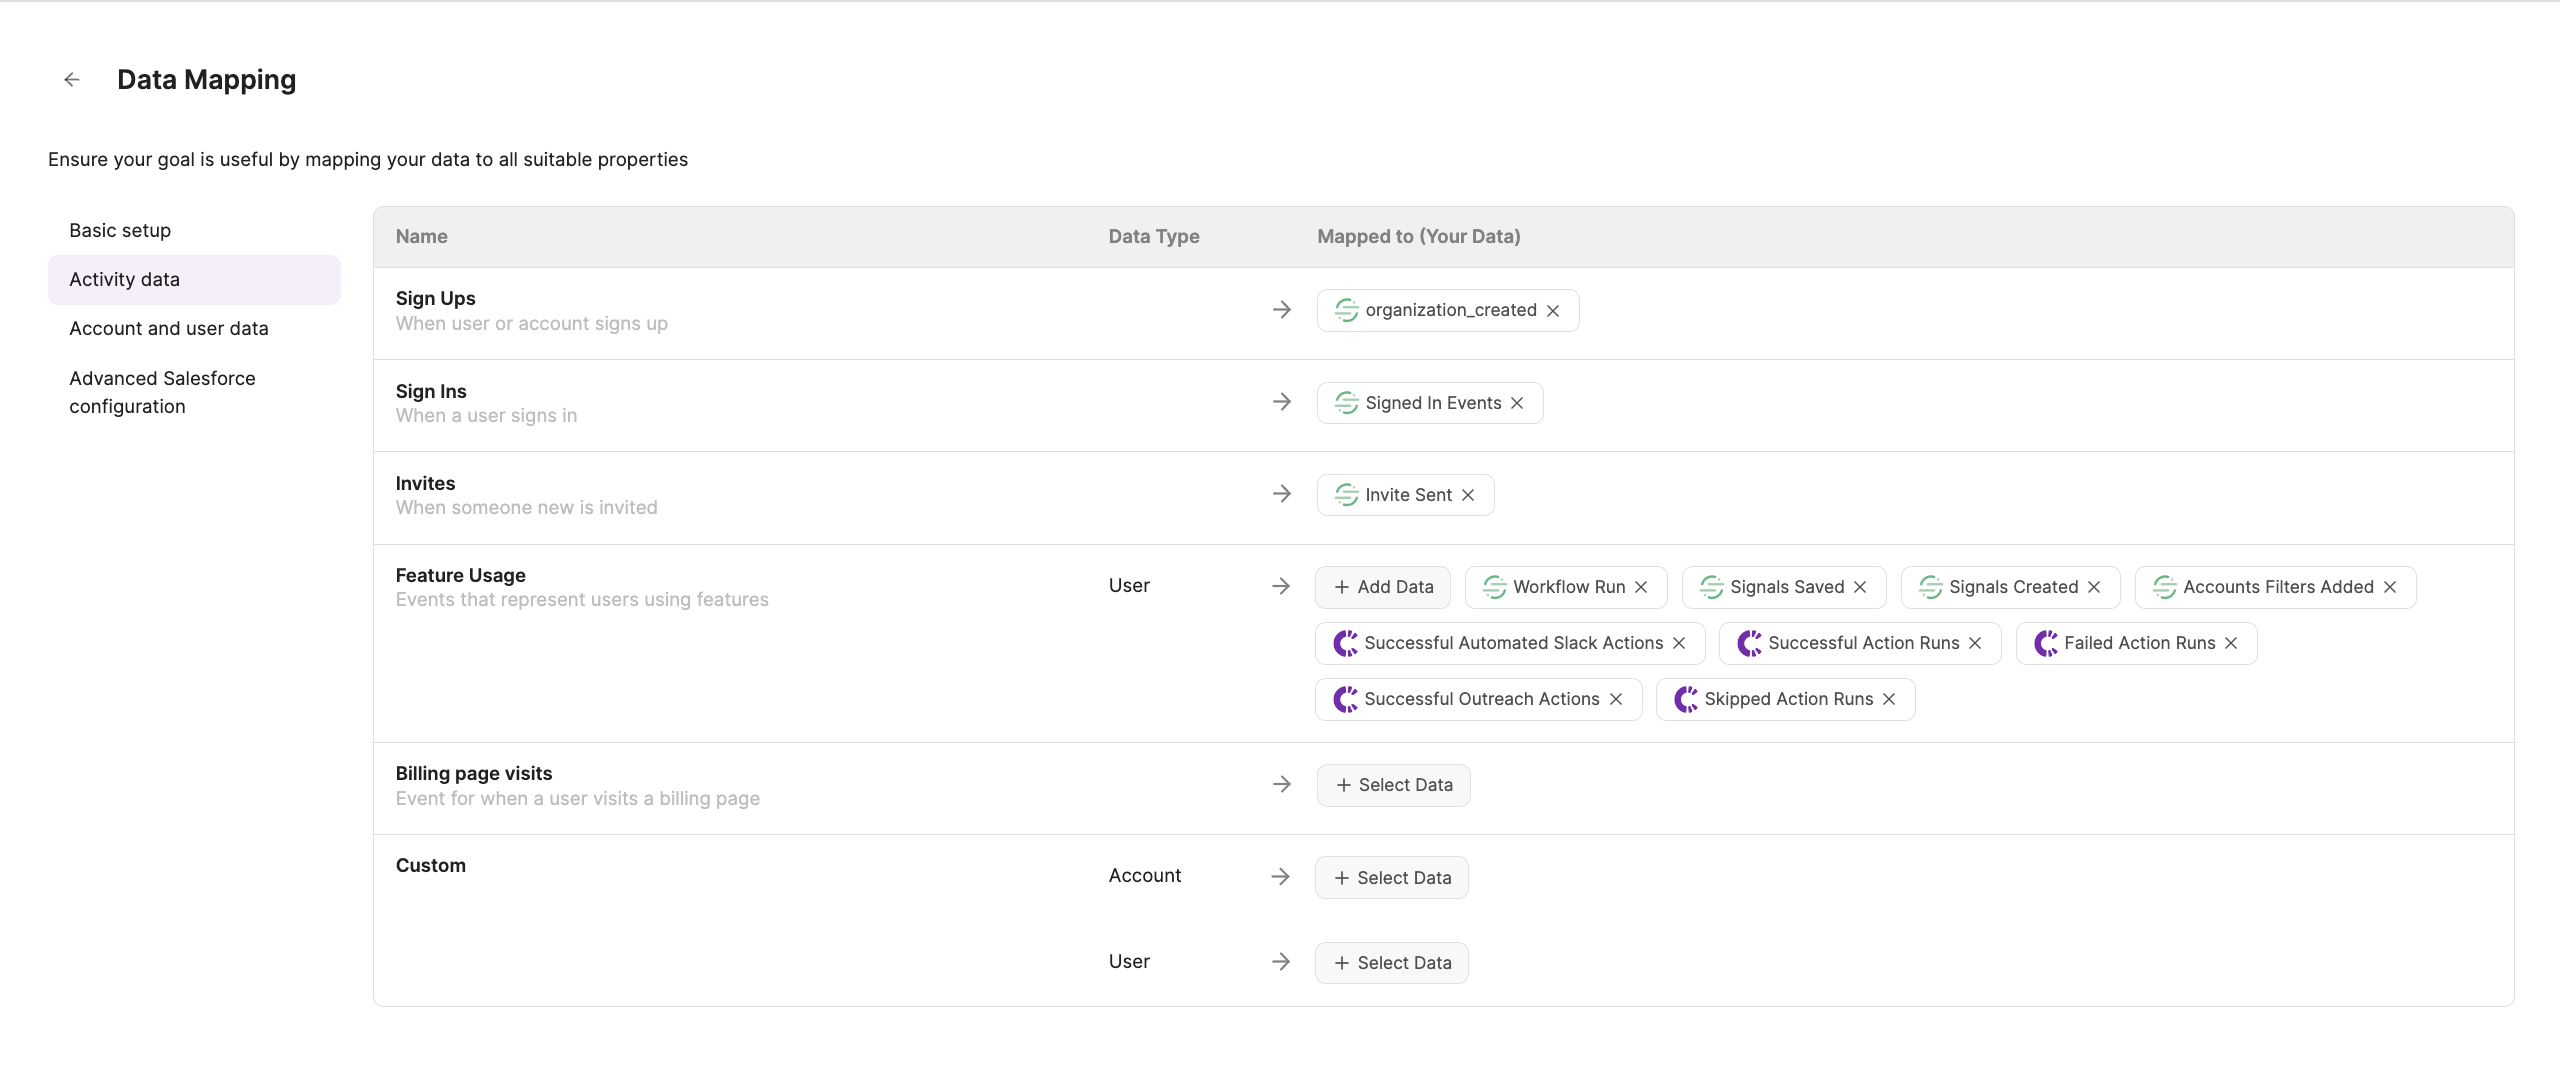
- Here, you'll want to map any of the relevant data from your sources to the suggested Correlated properties.
- "Activity data" will be for metrics (ie product events from Segment, Amplitude, Mixpanel, Hightouch, or Census).
- "Account and user data" will be for dimensions (ie firmographic or demographic data from your CRM, data warehouse, etc).
- Note:
- Any data you include here is the data we will use to train your models with! Anything not mapped, will not be included in your models. However, you can always configure individual models later on to remove any unecessary data.
- If you want to include data that does not perfectly match any of Correlated's suggested properties, you can include these in the "Custom" sections.
Goal
3. Navigate to Scoring to define your Goals across Stages.

- Before Correlated can help you score PQLs, you have to tell us more about your business's customer lifecycle. Correlated’s scoring model is very unique because you can build models for each stage in your customer lifecycle (Conversion, Onboarding, Expansion, and Retention) trained on your own data.
- For example, if you want Correlated to predict which Accounts are most likely to convert to paid, your goal might be "Customer Type = Paid" or "ARR > $0"
- Note:
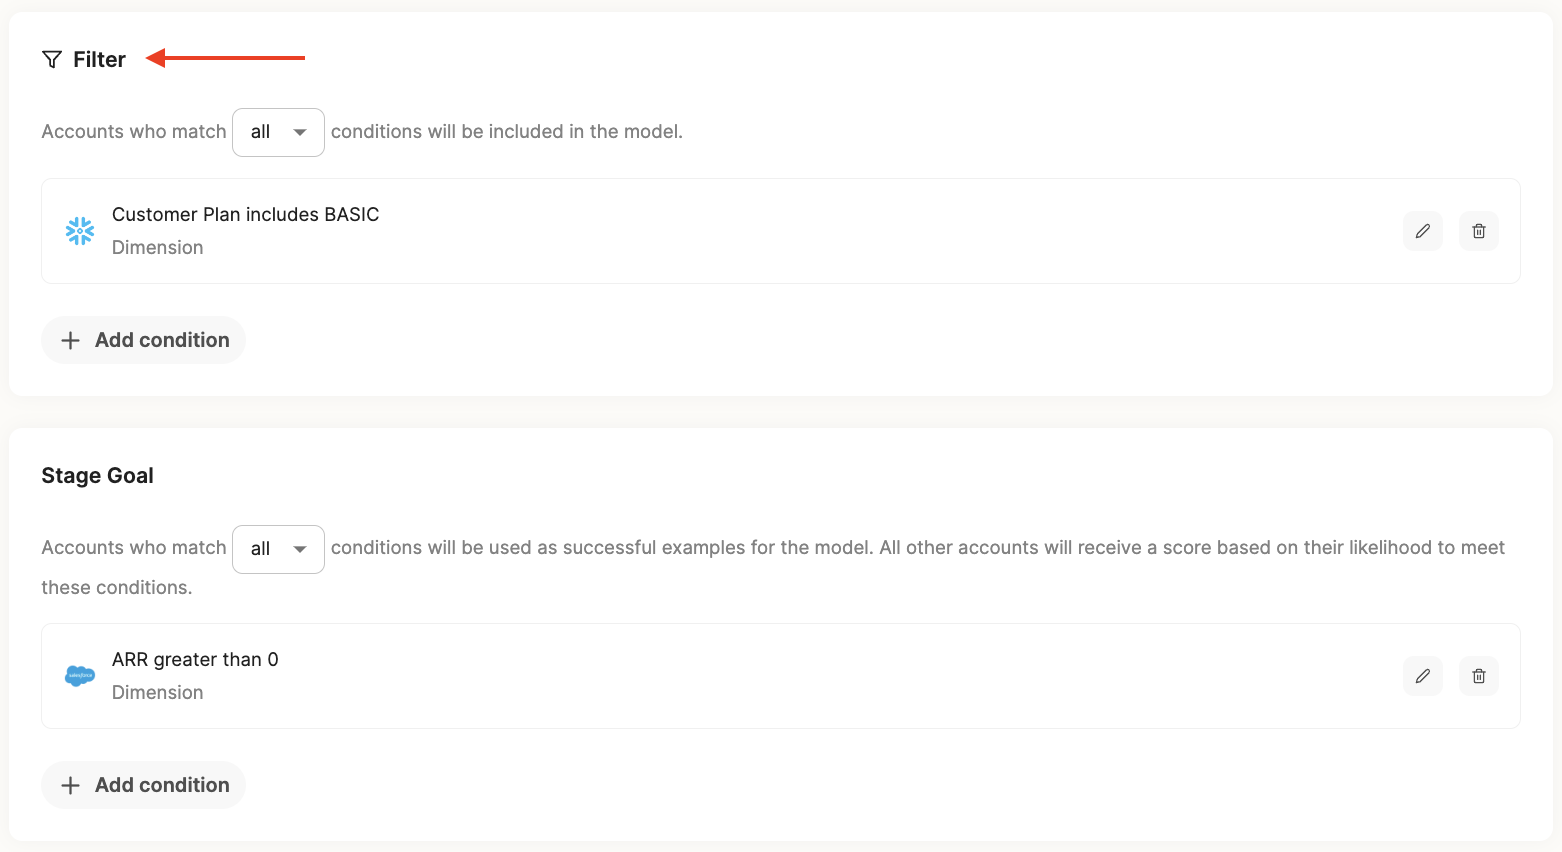
- You can create more precise goals by using "Filters" to focus on a subset of customers.
- For example, if you only want the conversion model to score your freemium customers on their propensity to convert to paid, filter for "Customer Type = Free" or "Plan = Self-Serve", or if you want to focus on expansion opportunities, filter for only existing customers like "ARR > $500" or "Plan = Premium."
Example Stage Goals
- Conversion Goal: This could be an event that marks someone as converted, or a data point that represents an active, paid customer.
- ARR > $0
- Plan = Business, Premium, Enterprise
- Credit Card Added > 0 of all time
- Expansion Goal: This could be an "upgrade" event or a data point that tags expanded users.
- Upgraded Plan > 0 of all time
- Expansion ARR > $0
- Onboarding Goal: This could be a combination of product events (like used Feature A and Feature B), or a data point that tags onboarded accounts.
- Users Added > 0 and Integrations Connected > 0
- Onboarding Complete = True
- Retention Goal: This could be represented by a lack of events over a period time or tagged as a data point when users downgrade or churn.
- Customer Type = Churned, Cancelled
- Active Users = 0 in the last 90 days
- Status = Inactive
4. Wait for Correlated to finish processing your results.
- Now that you’ve told us what you care about, give Correlated some time to run all of your imported data through the AI-powered model, based on the goals you defined.
- Note:
- Success indicators should process fairly quickly, depending on how much data you have in your instance (anywhere from 20 minutes to a few hours), but it can take between 24-48 hours to fully process Scores for all of your leads.

Scoring
5. Interpret your results.
- When the model is done processing, we will sort all of the features (aka indicators) that are most correlated to customers with the highest propensity to reach your goal.
- Additionally, we'll score all of the accounts and users who have not yet reached your goal on a scale from 1-100. 100 being the most likely to convert, expand, etc.
- Note:
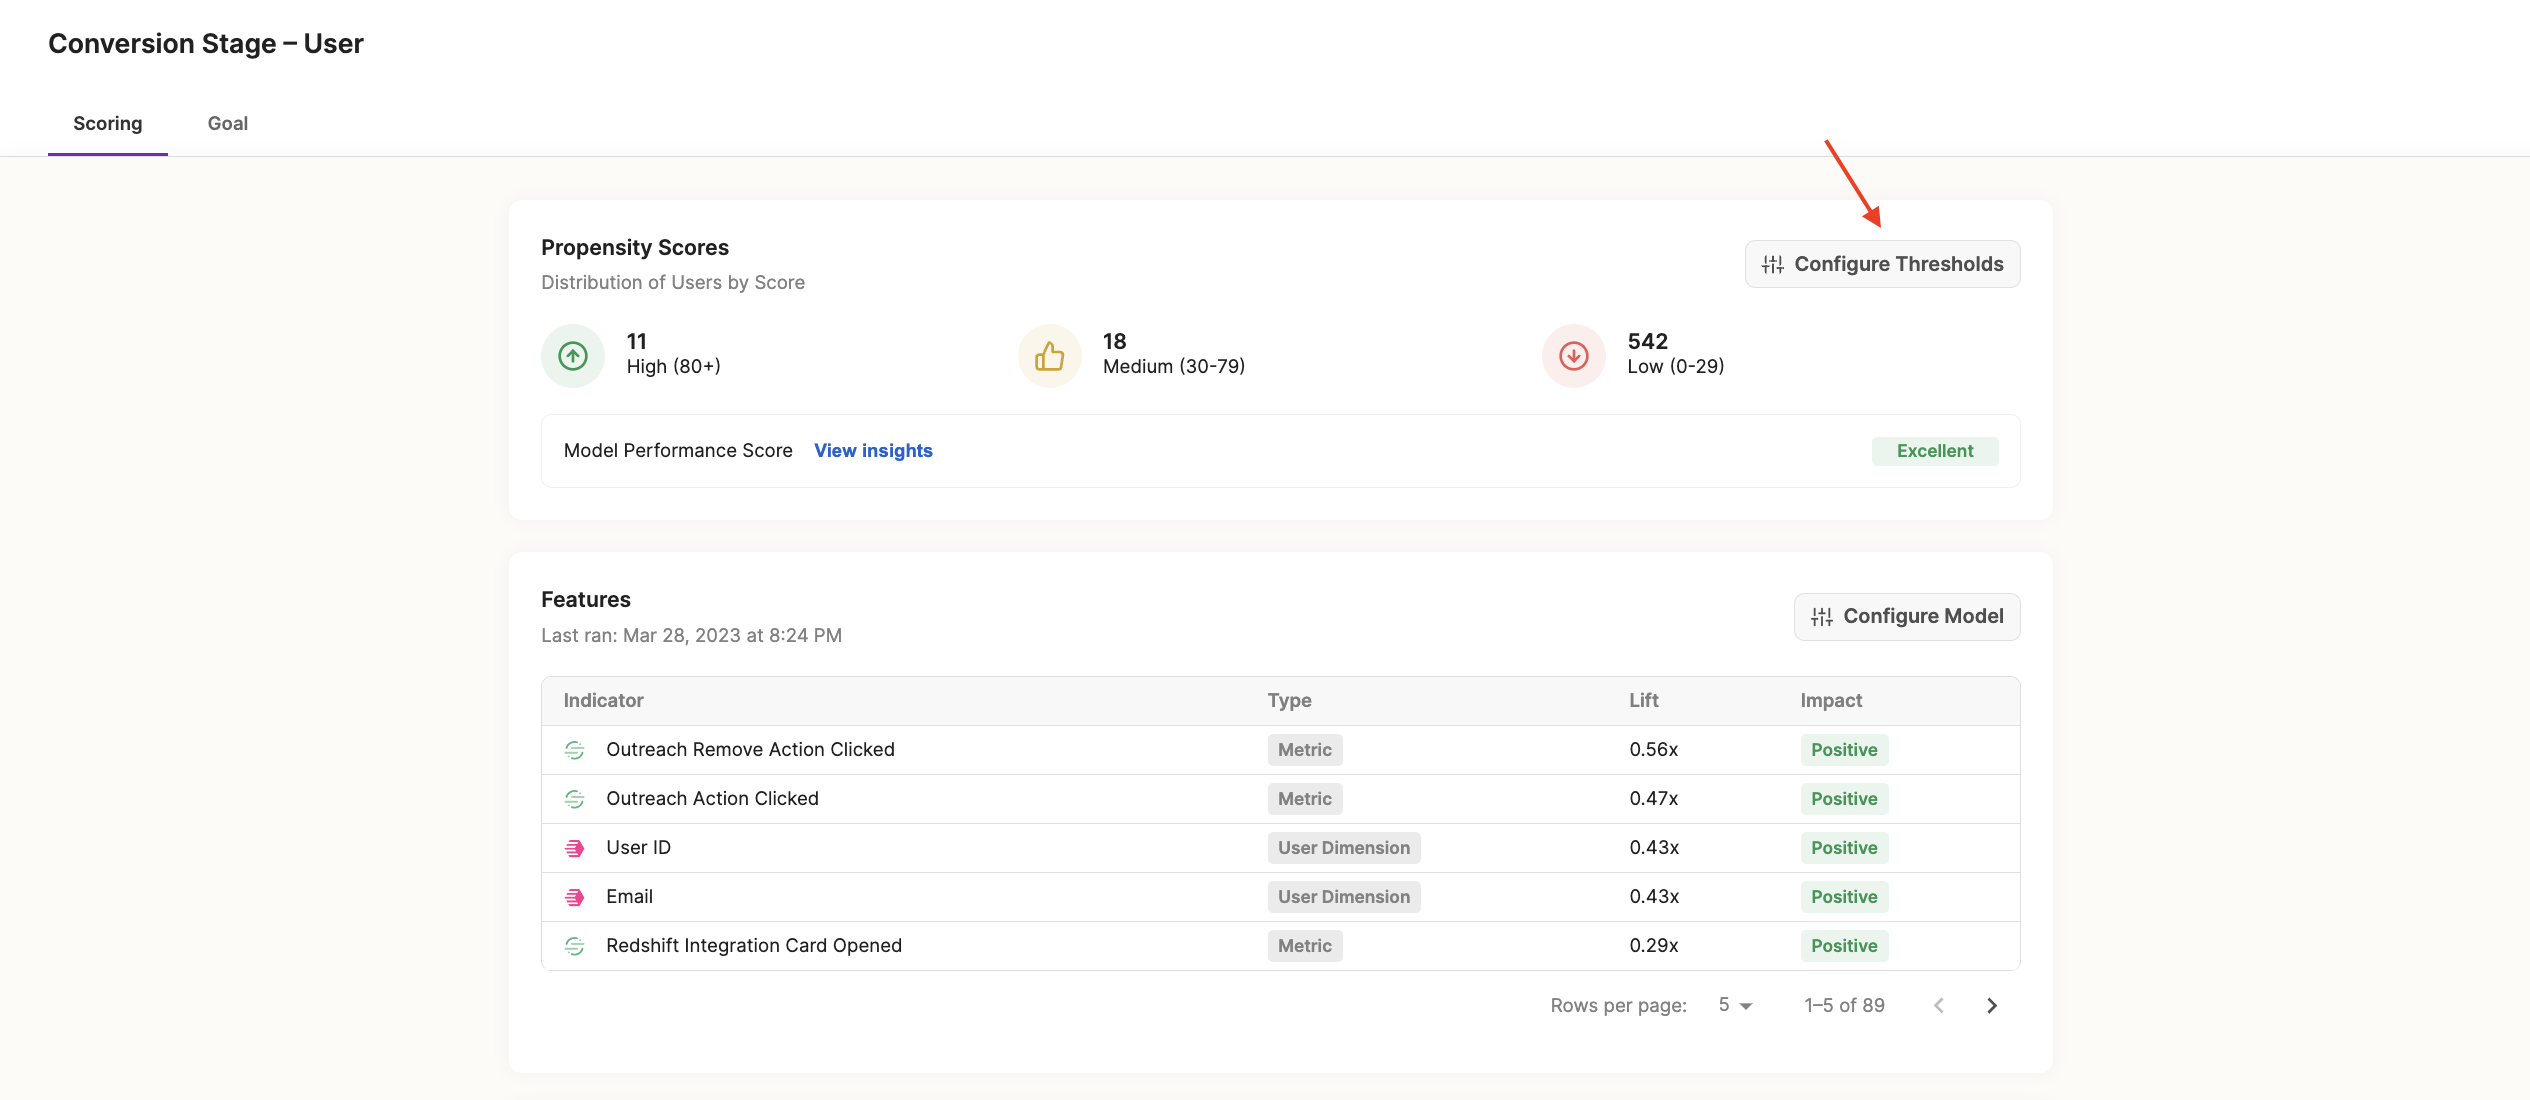
- You can easily see the distribution of accounts or users between High, Medium, and Low Scores from within the "Scoring" tab.
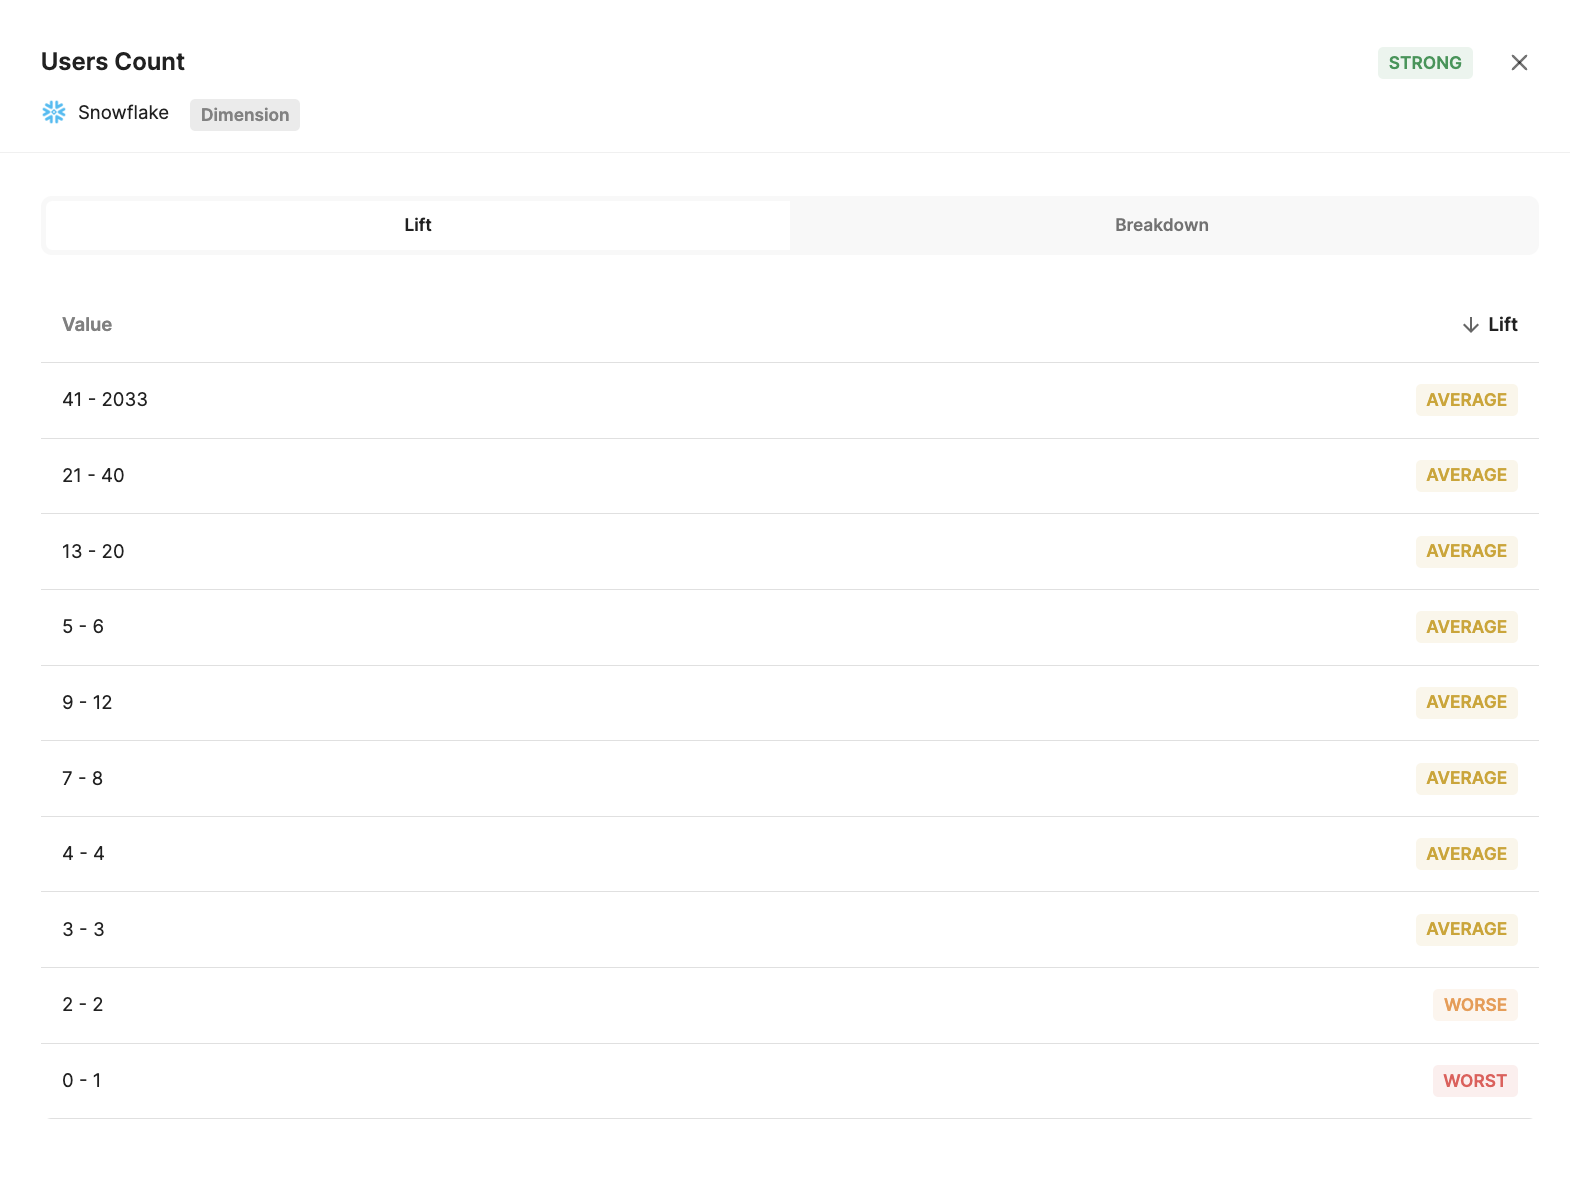
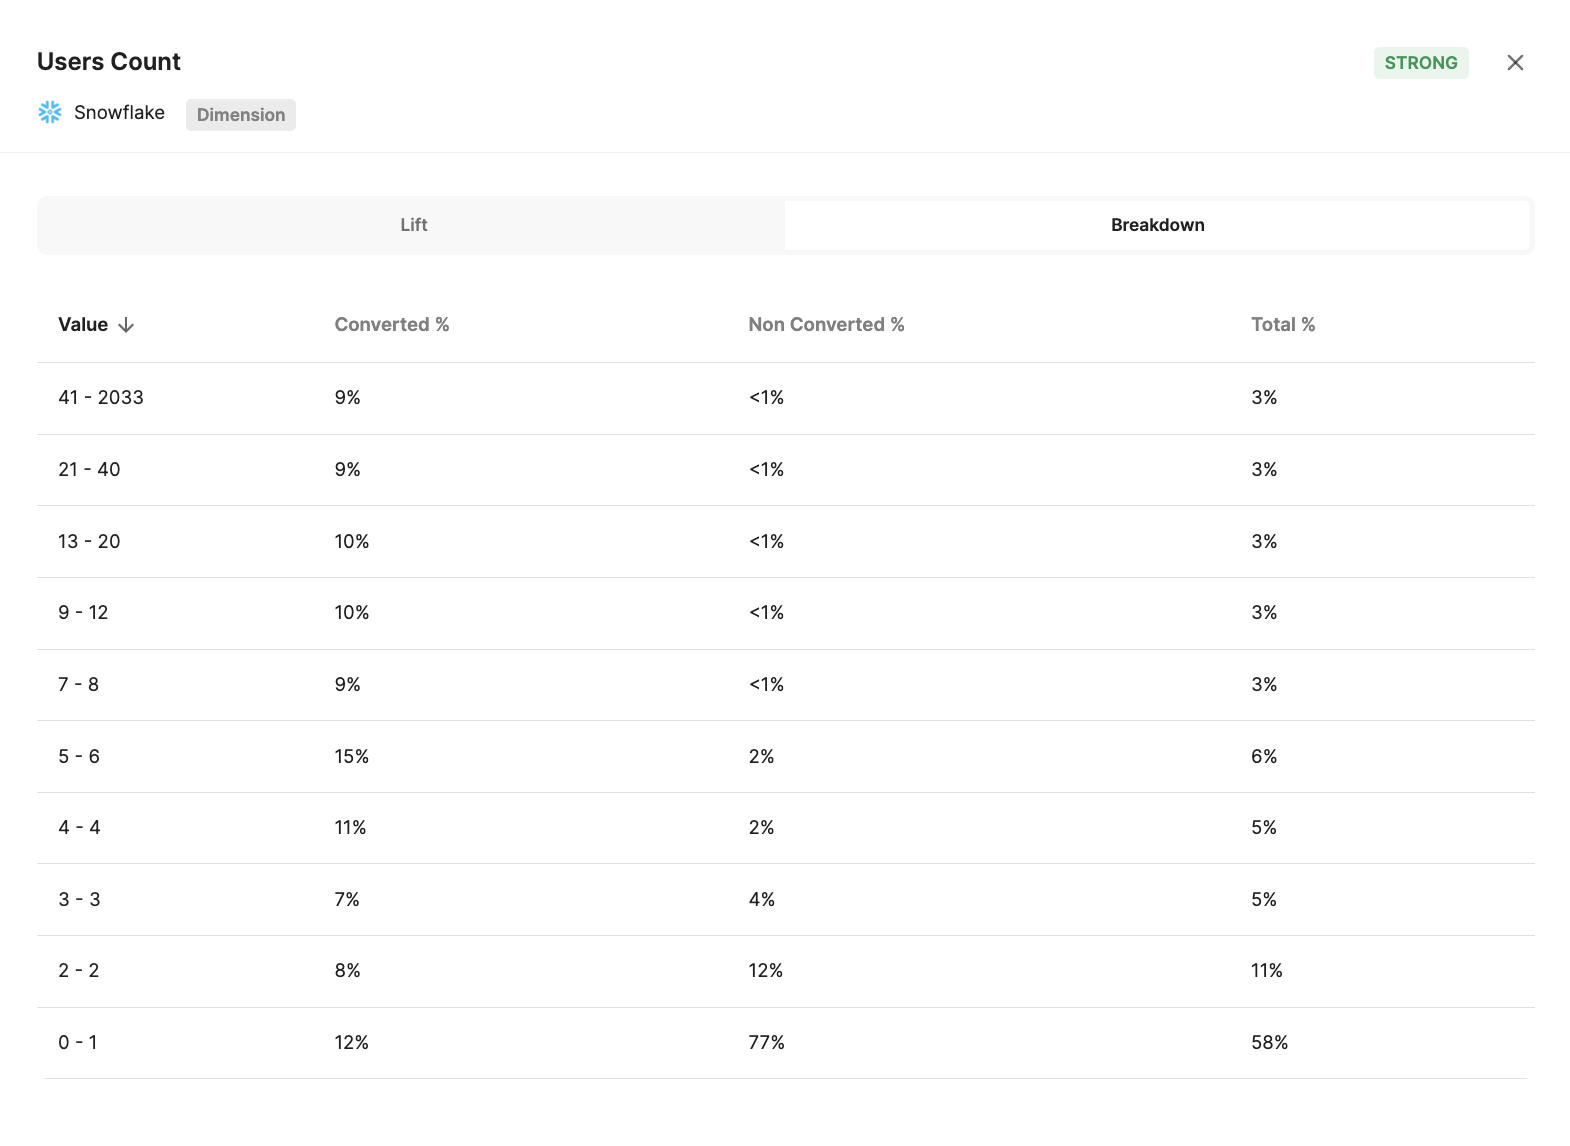
- We'll sort every feature by its significance / propensity to convert (Strong, Slight, or None) aka the Lift, and show the Breakdown (% of converted vs non converted accounts with the same indicator value).
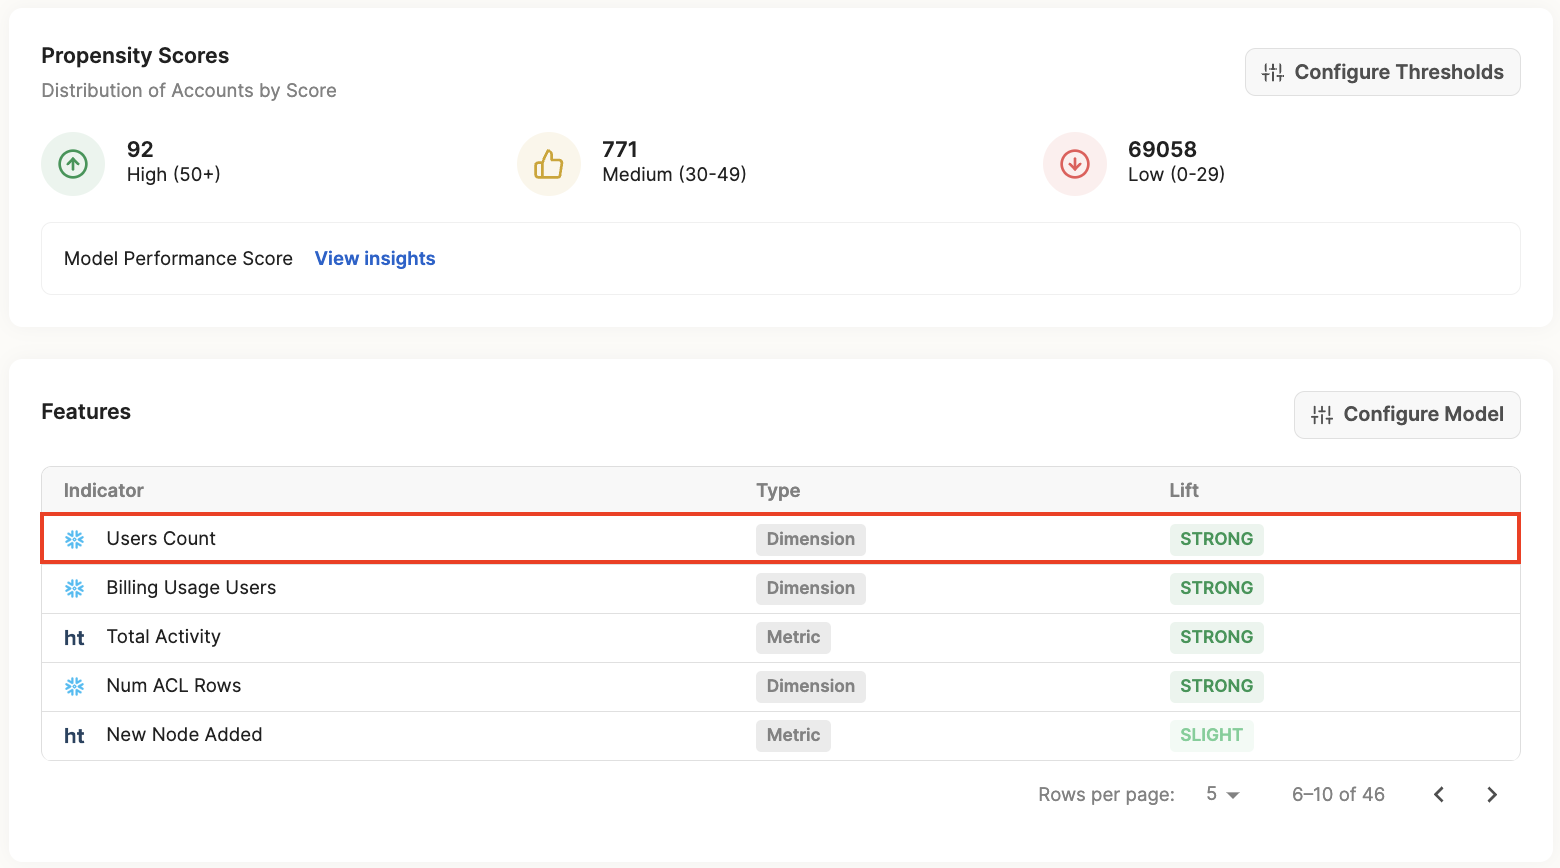
- For example, see the Lift and Breakdown for the dimension "Users Count" below.
- You can interpret the Lift as: the higher Users Count an Account has, the more likely they are to convert.
- In the Breakdown, you can see that 9-10% of Accounts with a Users Count value of 8+ have already converted, with less than 1% of those Accounts not converting.
- Also note that _majority _of Accounts fall between the 0-1 Users Count range, however they are way more likely to not convert than convert.
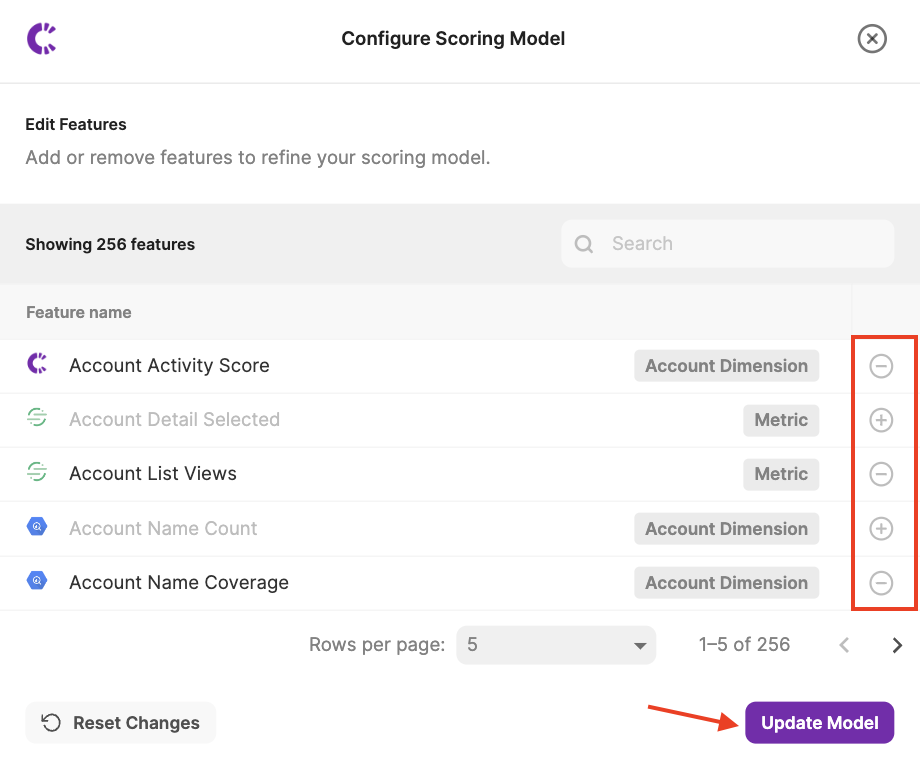
6. Improve the model.
- If any of the indicators Correlated generated look irrelevant, you can always improve the model by removing those "bad" indicators under "Configure Model" in the Scoring tab. Correlated will then re-run the model and pull in the next most relevant indicators.
- It is best practice to remove any indicators that are too similar to the stage goal you have set. For example, if your conversion goal is "ARR > $0" and you have an indicator like "Plan Status = Paid" you should remove this from the model as it could mess with your results.

- Correlated will also surface the model's Training Results under "Scoring Model." This is useful because we will display specific recommendations based on your data set.
- For example, we'll notify you here if the goal you have defined is too narrow and we do not have enough positive samples or features to run the model and produce significant results.

7. Operationalize your scores with Playbooks.
- Now that you’ve achieved a PQL Score using Correlated, you can deliver the highest scores to your sales team, automatically! Correlated comes with robust Playbook capabilities, including downstream support for Salesforce, Hubspot, Outreach, Salesloft, Marketo, and Slack.

- We recommend testing your Score by sending a Slack alert to reps when a lead receives a high score. You can include any additional information the rep needs to follow up and confirm it's in fact a good lead within the Slack message.

- Another great use case is automatically syncing your new high scores to fields in Salesforce, so your team can build robust reports and prioritized lists.

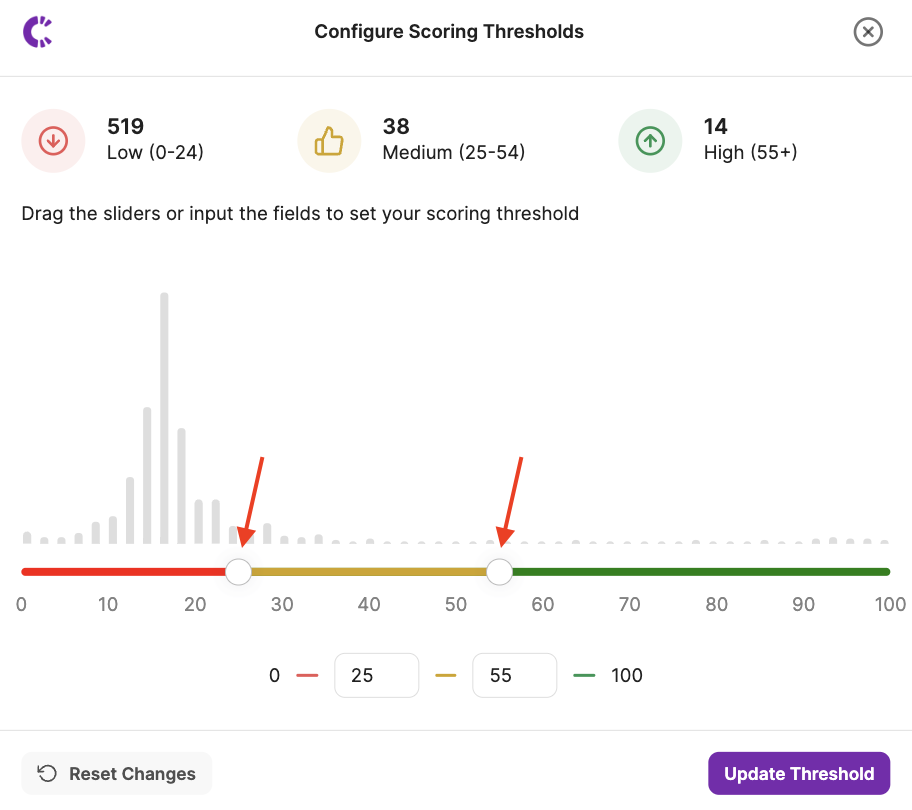
8. Adjust your score thresholds.
- If you've noticed that you aren't seeing as many "high" scoring PQLs as you may expect, simply adjust your scores to tweak what a high, medium, and low thresholds looks like. Click "Configure Thresholds" and use the slider bars, or manually enter what scores you would like to represent high, medium, and low and click "Update Thresholds."
- Note: Updated thresholds may take around 20 minutes to reflect in Playbooks.
Report
Updated almost 3 years ago